Maps & Infographics for publications & presentations
Academic / policy research in visual format
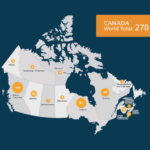
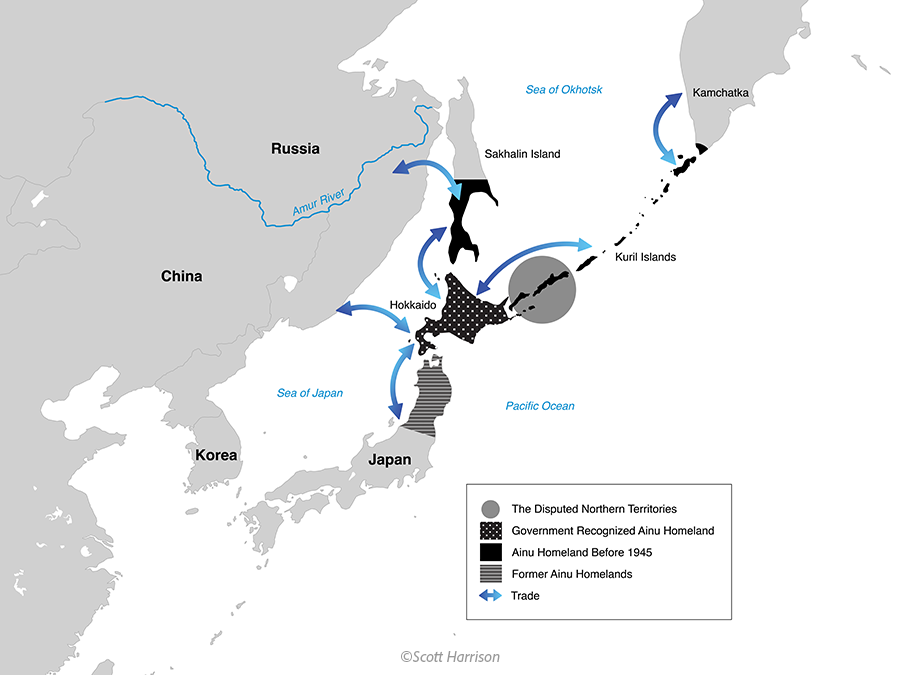
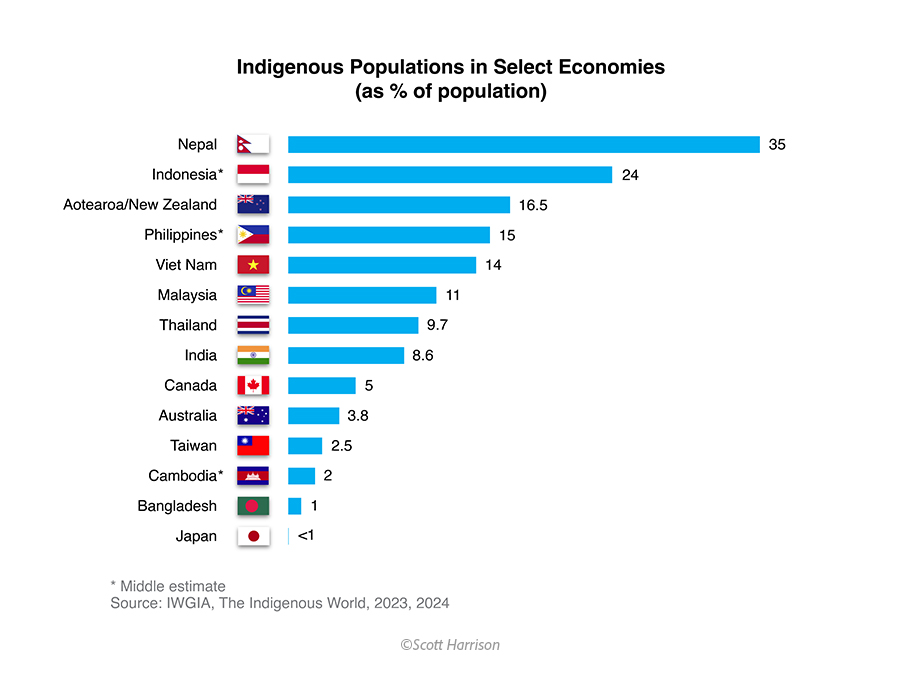
Here are examples of infographics and maps created to support Dr. Harrison’s academic and policy research, publications, conferences, and presentations. The visually striking design complements his eye-opening research and has been well received—making a strong impact both nationally and internationally over the years.